In the first part of my cloud-native blog series, I talked about who I am, what I did, and what I am doing now. If you want a short intro, you can start there, but if you are just here for the good stuff, let’s dive right into it.
In this blog post, I want to give you a way to set up a Kubernetes-Cluster in Azure with a modern stack consisting of easy deployment and observability. I am writing this article because, during a previous project, I sifted through countless documents and websites. Now, I want to impart my knowledge and provide you with a more accessible gateway to this world. Don’t get me wrong, for a more profound understanding and more advanced stuff, you will still need to get through a lot more reading, but I think this will help you for a quick start. I also did most of the stuff with a self-managed cluster, so doing this in Azure is new for me, but I wanted to try it out and learn something. The self-managed cluster had an infrastructure team, which managed the more complex operational tasks, like setting up the whole cluster. That is also why I used Azure and its provided services because managing the whole cluster is still a completely different task and should not be covered by DevOps.
Let’s start with a short list of the components I used and an introduction.
Kubernetes / K8s
If you are here, you probably know what K8s is or what it is used for. For all the others: K8s is an open-source system for automating deployment, scaling, and management of containerized applications. It groups containers that make up an application into logical units for easy management and discovery.
It is really as awesome as it sounds, and if you are not using it, hopefully, this will change after you set it up following this post ;)
Azure
Azure is Microsoft’s public cloud computing platform and the infrastructure I decided to use for my project setup. I mainly used it because I heard many positive things about it and wanted to try it out, but also because it seems it will be the most important and widely used provider here in Europe, especially in highly regulated markets where my company is mostly operating in. Also, because of all the excellent features they provide and how they can be used. The first project I did was with pure K8s, so I also learned a lot by doing it with Azure / AKS, and I hope I did not oversee an easier way to set up certain things. Otherwise, please let me know :)
Azure K8s Services / AKS
AKS is based on K8s, offers more functionality, and simplifies the handling of K8s by reducing the overhead of some actions. As the name suggests, it is Azures version of K8s and well integrated into it, so we will use it for our project.
ArgoCD
ArgoCD is a tool for users to follow the GitOps pattern and implement better continuous delivery in K8s. GitOps uses Git-Repositories as the single source of truth of the whole infrastructure so that every state can be reproduced and understood. ArgoCD tracks branches to enable automatic deployments based on pushes, which means a significantly increased speed in deployments. It also makes these processes more clear and more transparent.
Kustomize
Kustomize is a tool for customizing Kubernetes objects such as Deployments, ConfigMaps, and Services. It provides a way to create and manage Kubernetes YAML manifests, allowing users to define, deploy, and update application configurations across different environments without having to maintain multiple copies of the same YAML file. With Kustomize, you can create a base configuration and then overlay it with specific changes or customizations for different environments, making it easier to manage configuration files and apply changes consistently. Kustomize is an open-source project that is maintained by the Kubernetes community and is often used in conjunction with other Kubernetes tools and technologies.
Helm
Helm is a package manager for K8s, which also takes away lots of writing and simplifies the deployment process.
Now you are probably confused why I use Kustomize and Helm. While both Kustomize and Helm are popular tools for managing Kubernetes applications, there are some reasons why I prefer Kustomize over Helm:
- Simpler than Helm: Kustomize is often considered to be a simpler tool than Helm. It doesn’t have as many features as Helm, but it can be easier to learn and use, especially for smaller or less complex projects. Besides, I find it way easier to read.
- Built into kubectl: Kustomize is built into kubectl, the Kubernetes command-line tool, which means that users don’t need to install any additional software to use it. This can make it more accessible to users who are already familiar with kubectl.
- Declarative configuration: Kustomize uses a declarative approach to configuration, which means that users can define the desired state of their applications and let Kustomize handle the details of how to achieve that state. This can make it easier to manage configuration files and apply changes consistently across different environments.
- Better integration with GitOps workflows: Kustomize is often used in GitOps workflows, where changes to application configurations are managed through version control. Kustomize’s approach of using overlays to manage configuration changes works well with Git’s branch and merge model, making it easier to manage changes over time.
Of course, the choice of tool depends on the specific needs and preferences of the user and their project, so it’s important to evaluate both Kustomize and Helm (and other tools) to determine which one is the best fit for the job at hand.
Grafana & Loki
Grafana is an open-source monitoring, visualization, and analytics platform which allows you to create charts, graphs, and alerts for your application. Loki is a database that can be connected to Grafana, where aggregated logs are stored and can then be visualized and searched by Grafana. Together, they make monitoring applications easy (if you can create nice dashboards ;)).
Prometheus
Prometheus is a time-series database with some additional features for observability, a way more advanced alerting system, and functional query language to create them. Mainly, the practical alerting system is why I chose to use it. In addition, it has become the de facto standard for observability solutions in cloud-native environments.
Tracing
For a complete observability stack in a distributed system, we would still need a solution/technology for tracing. This will not be covered here.
Setup
In the second part of this blog post, I will explain how to set up an AKS with the technologies mentioned above to create a K8s cluster with a modern deployment and observability stack.
Azure
If you don’t already have one, the first step is to create an Azure account. This is a fast-forward registration process, where you must set up a payment method. The first 200$ is free. After that, you must choose a subscription type, depending on your context. For me, the 200$ was way more than I needed to get the first fundamental version running because you only pay when your services are running, and if you always stop everything after your development sessions, it shouldn’t cost much. You must choose a fitting subscription model when running something permanently in production or for a testing system.
AKS
The next step is to create a K8s cluster. As mentioned in the intro, Azure provides its own K8s version, AKS, so we will use this.
1. Go to “Create a Resource” and choose “Containers -> Kubernetes Services”

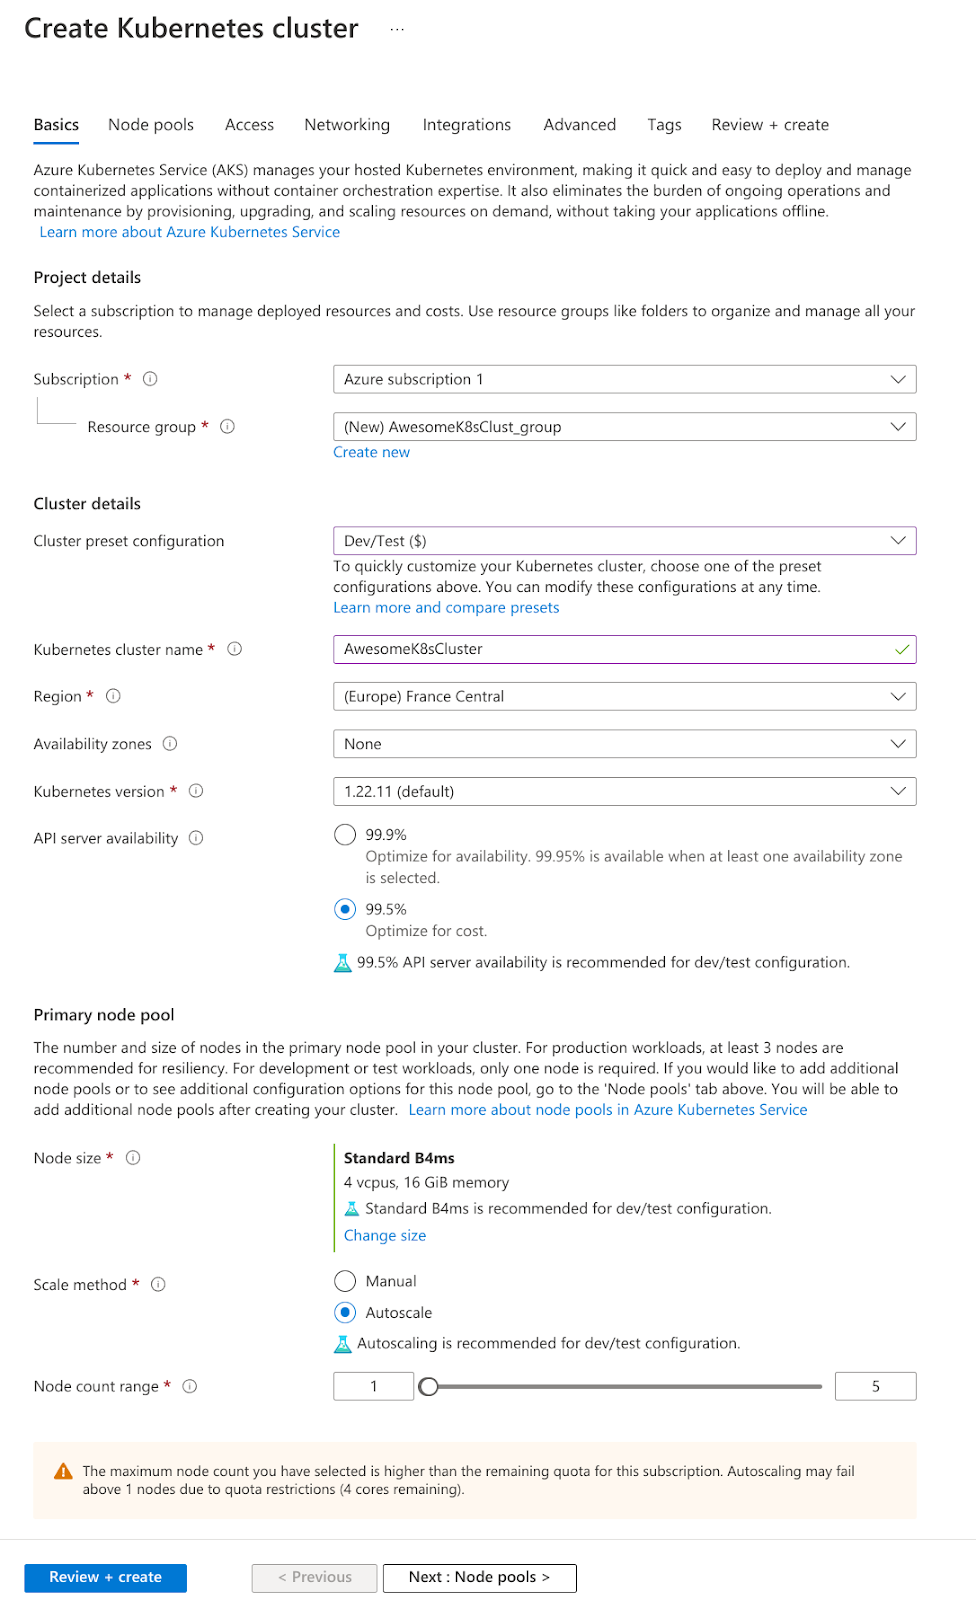
2. Then you have to configure some basic options for your cluster:
- Choose your subscription, which you want to use for your payment of the service
- Create (or choose) a Resource Group which the cluster will use
- Choose a Preset configuration. I chose “Development” because it was purely for trying out. If you want to use it in production, choose something that fits your needs or, if unsure, choose “Standard”.
- Enter the name of your cluster (such as AwesomeK8sCluster)
- Then you have to select a region. I had to try out some regions before my desired configuration was available (but maybe just because I wanted the bare minimum for trying it out). Otherwise, just leave the default values.
- For server availability and node count, choose something that fits your requirements. It was 99.5% availability for me and just two nodes for testing.

3. If you want/need, you can click through the next steps of the wizard, but for me, the default settings were good enough.
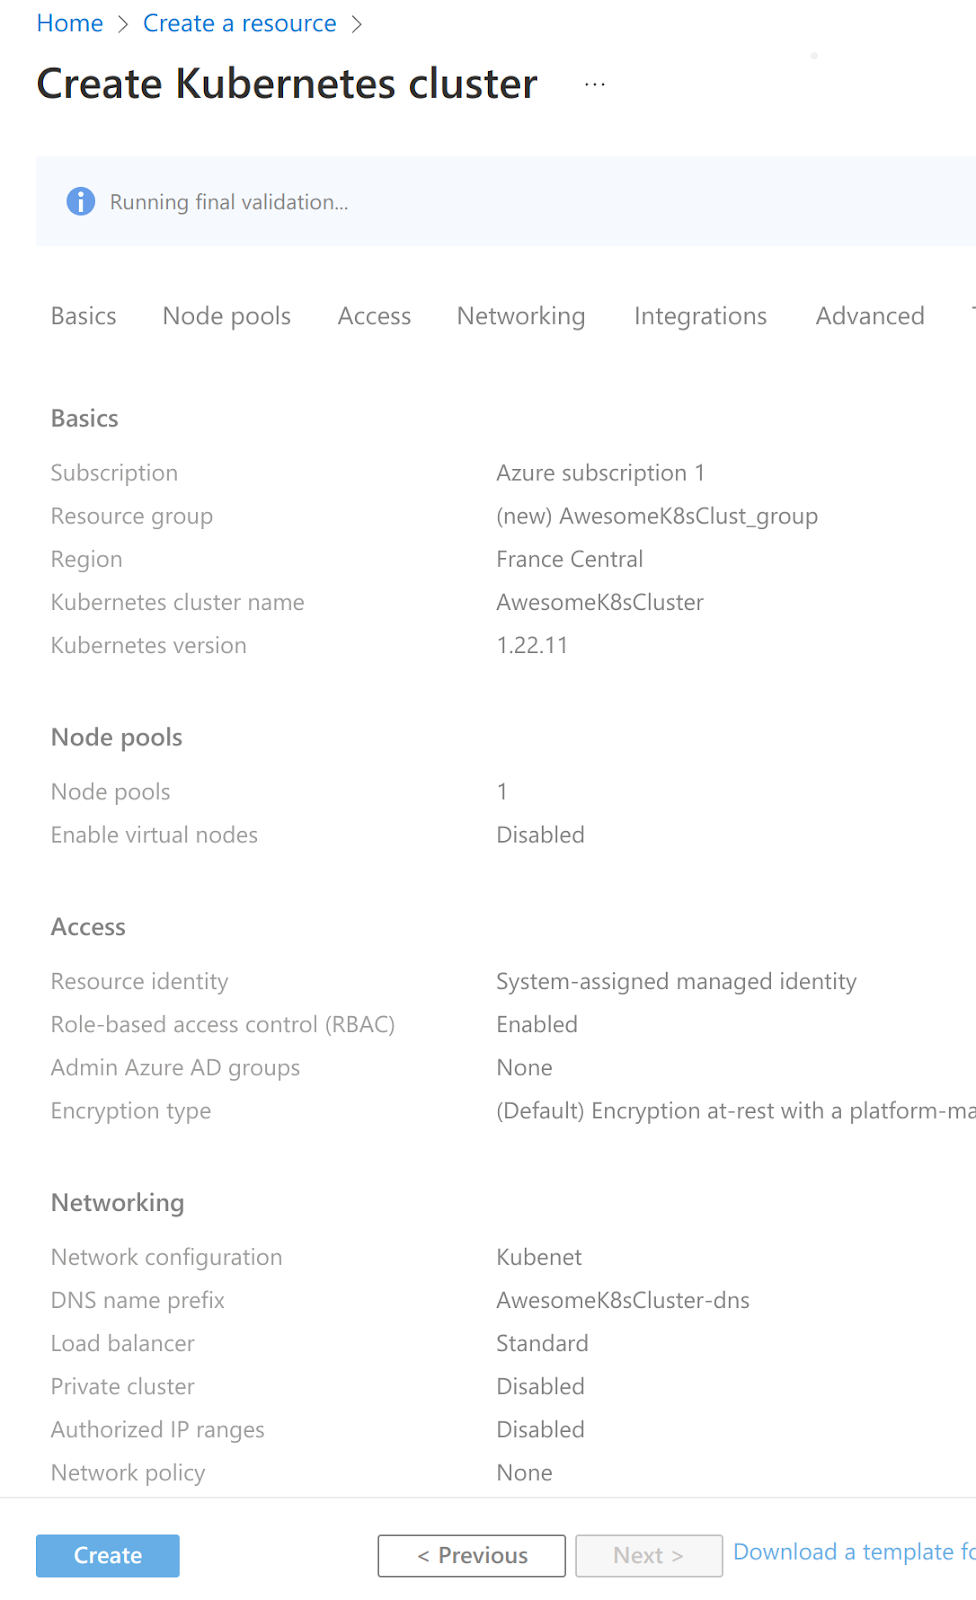
4. If you are ready, click “Review + create”. This will take some time, but if you entered everything correctly, you can click “Create”, and your new AKS cluster will be available shortly.

5. To manage your AKS, you can use the directly built-in command line tool in Azure (on the top right), or you can connect your local shell by installing “Azure CLI” and executing “az login”.
ArgoCD
1. In your AKS create a dedicated namespace with “kubectl create namespace argocd”
2. To install ArgoCD, we can simply use the GitHub repo for the operator: kubectl apply -n argocd -f https://raw.githubusercontent.com/argoproj/argo-cd/stable/manifests/install.yaml
3. To verify the installation, you can run “kubectl get all -n argocd”
4. Now, to access ArgoCD, to verify it is running, you have different possibilities. The initial password you can get from
“kubectl -n argocd get secret argocd-initial-admin-secret -o jsonpath=”{.data.password}” | base64 -d; echo”
- For simple testing, you can change the type of the argocd service to a LoadBalancer with the following command:
“kubectl patch svc argocd-server -n argocd -p ‘{“spec”: {“type”: “LoadBalancer”}}’” Like this you can directly access argocd with the IP you get from the following command “kubectl get svc -n argocd” - Ingress: A short introduction to the azure ingress is in the next point. A more detailed intro for argocd can be found here: https://argo-cd.readthedocs.io/en/stable/operator-manual/ingress/
5. You must connect ArgoCD to your (private) repo to deploy applications. To do so, you have to
- Generate a new ssh key pair
- Add the public key to your repo (e.g., GitHub add Deployer Key)
- Add the repo (in repoUrl) and private key in argocd. You have two possibilities here:
- Either do it via the UI. You can add the repoUrl and private key to access your private repo
- Or use the declarative approach by using config yamls.
- For a more detailed description, use this: https://levelup.gitconnected.com/connect-argocd-to-your-private-github-repository-493b1483c01e
6. For my test, I created an example repo with all the monitoring applications: https://bitbucket.org/MrJon/azure-monitoring-apps/
Helm & Kustomize
They already come with AKS, so no additional steps are needed
Grafana
I set up Grafana using ArgoCD and Helm. You can check it in the linked repo.
“application-grafana-chart.yaml” is the main yaml file, where I define the repoUrl and version. I also did some additional configuration, e.g., where to find the local Loki and Prometheus instances.
“grafana/kustomization.yaml” This should show the Kustomize usage. E.g., I configured it here, where the dashboards can be found.
“grafana/dashboards” Here, you can add your Grafana dashboards, which will then be automatically added to your Grafana instance.
Loki
Same for Loki, I used Helm to set it up.
“application-loki-chart.yaml” Again, this is the main yaml file, where the repo for the helm files and some additional config is set.
Prometheus
Prometheus is also set up using Helm, but not in ArgoCD because I want it to be available cluster-wide and run independently of ArgoCD, so it can also be used by applications outside the namespace. To install it, simply execute
“helm install prometheus-stack prometheus-community/kube-prometheus-stack”
It is a specific stack for K8s with some additional features, which you can check out at https://github.com/prometheus-community/helm-charts/tree/main/charts/kube-prometheus-stack
Ingress
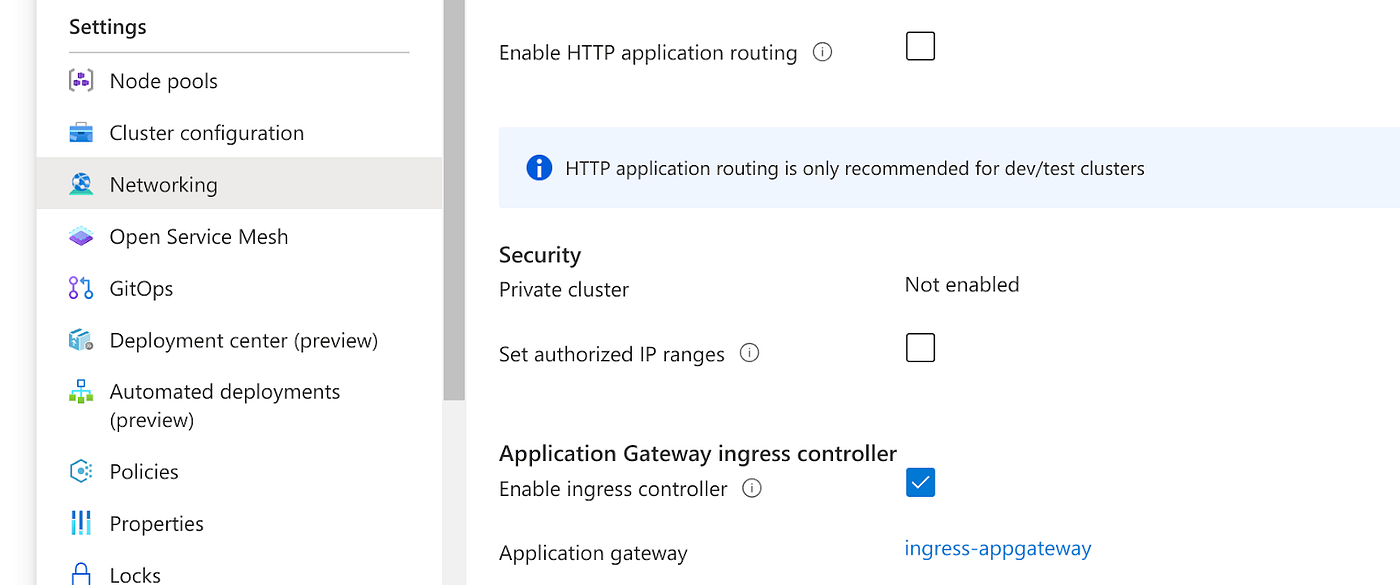
As ingress, azure offers an easy built-in solution. Select your cluster, go to Settings->Networking, and click “Enable ingress controller”.

After that, you can create routes to your applications / services and access them outside. An example of a simple route is in the repo in the Grafana folder.
So there you have it, your own monitoring stack in AKS with ArgoCD. What’s left now is developing your own application, adding the needed metrics configuration, and creating dashboards and alerts for them. Have fun, and happy deploying and monitoring! :)
Conclusion
In conclusion, setting up a Kubernetes deployment and observability stack in Azure is quite easy, especially with the right guidance and tools. In this blog post, I have provided a step-by-step guide to help you get started, and I hope it has been helpful. However, if you have any questions or feedback, please feel free to message me. I am always happy to help and always looking for ways to make the process easier and more efficient. Thank you for reading, and I wish you the best of luck with setting up your own AKS.
Explore Our Latest Insights
Stay updated with our expert articles and tips.
Discuss Your Web Development Project with Our Experts Today.
Discover how our tailored web development solutions can elevate your business to new heights.
Stay Connected with Us
Follow us on social media for the latest insights and updates in the tech industry.


