

Many infrastructure decisions had to be made during the development of a big recent project in the public sector. We did not look at monitoring in our project as a nice-to-have. We took it very seriously from the start. Navigating this monitoring infrastructure gave me a much deeper, hands-on understanding of the modern observability stack: Grafana, Loki, Promtail, and Prometheus.
At first, it was not clear to me why we needed a full observability stack. I understood the importance of having logs from the microservices and getting a notification when the website is down, but the complexity of the stack felt like overkill to me. I started fully understanding the importance of the monitoring infrastructure after we went live. Within the first few days, our monitoring infrastructure caught backend exceptions and errors before users even noticed them. With the help of structured logs, it directly showed us the issue without any extra debugging.
Being part of this large project taught me that monitoring isn’t just about knowing when things are broken. It’s about finding problems before they turn into incidents. Monitoring infrastructure also makes you feel more confident as a software engineer in your product, because you know that even if something goes wrong, you won’t need to do any guesswork. Your infrastructure tells you exactly what’s happening.
Getting to that point, though, required making a series of architectural decisions. Here are the three lessons that stuck with me the most.
Lesson 1: How Logs Get Into the System Matters More Than You Think
For our logging backend, we chose Grafana Loki. Loki is a log aggregation system designed to store and query logs from all your applications in one place. Unlike other tools like Elasticsearch from the ELK stack, which try to index every single word of every log line, Loki only indexes the labels and metadata tags (like application name, environment, or pod ID) as key-value pairs that make up structured logs. Because of this approach, Loki uses less storage and is cheaper to run, since it stores logs in compressed chunks instead of fully indexing them. Tools like Elasticsearch are stronger when you need a powerful full-text search or complex queries across all log data. This made Loki a simpler and more cost-efficient choice for our project.
Beyond just storage, choosing Loki also dictated how our data moved. The standard way to get logs into Loki is by pushing them. An agent like Promtail sends log entries to Loki as they happen, rather than Loki actively reaching out to pull or collect them. This architecture is crucial because log events are highly unpredictable. During quiet periods, there is almost nothing, but during an incident, there is a flood. A major advantage of this push model is network efficiency. When there is no traffic and no logs are being generated, nothing gets sent.
For comparison, outside of the Grafana world, the ELK stack also typically receives logs pushed to it — via Filebeat, Logstash, or direct API calls. Logstash can also pull data from sources like databases on a polling schedule, but that’s a niche use case, not the norm. Push-based log collection isn’t unique to Loki, it’s the industry default for good reason. The difference between ELK world and the Grafana world is not about how logs travel through the system, but rather how they are stored. It is the difference of indexing only the metadata labels instead of the full text.
The more interesting question for us wasn’t push vs. pull. It was: who does the pushing?
Lesson 2: Keep Your Logging Decoupled From Your Application
When implementing log shipping to Loki from our Spring Boot and Kotlin microservices, we had to decide exactly how those logs would make the journey. Currently, our project uses an agentless approach. We rely on a Loki Logback appender, a library added directly to our Spring Boot projects. In practice, this means Logback is configured (via logback-spring.xml) with an extra appender that intercepts every log event at runtime and forwards it directly to Loki over HTTP. Each time your code calls something like “logger.info(…)”, Logback creates a LoggingEvent, enriches it with metadata (timestamp, log level, thread name, MDC fields like traceId, etc.), formats it (often as JSON), and the Loki appender ships it immediately.
The application therefore does both the writing of logs and delivering them to Loki. The advantage is simplicity: no extra infrastructure, and you get perfectly structured JSON logs out of the box because the appender has full access to the logging context.
The trade-off, however, is that your application’s health becomes intimately coupled with your logging infrastructure. If the network drops or Loki goes down, the in-app appender must handle timeouts, retries, and buffering. In the worst-case scenario, if not configured correctly, a blocked logging thread can degrade or even hang the application completely.
The alternative is using a dedicated shipping agent. While Promtail used to be the standard here, Grafana has been actively moving away from Promtail toward Grafana Alloy (formerly Grafana Agent). Alloy is especially powerful because it handles logs, metrics, and traces all in a single binary.
So, how does this actually run? Unlike the Loki Logback appender running inside the Java process, Alloy is an independent process. In a Kubernetes environment, it is typically deployed as a DaemonSet (one Alloy instance running on every node, gathering logs from all pods on that node by reading their console output) or occasionally as a Sidecar (a separate container running inside the same pod as your application).
While earlier I noted that the agentless Logback appender gives you structured JSON logs out of the box, you can absolutely achieve the exact same structure with an agent like Alloy. To do this, you configure your Spring Boot application to simply write its logs as JSON strings directly to the console. The Alloy agent (or Promtail) reads these raw console streams and uses processing pipelines like a JSON parsing stage to automatically extract those JSON fields and map them into Loki labels and structured metadata before shipping them off.
For a project with 10+ microservices, deploying an agent as a DaemonSet provides an incredibly valuable separation of concerns. Because the external agent handles the heavy lifting of parsing and shipping, a logging issue never becomes an application issue. If I were starting fresh, I would strongly advocate for the agent-based approach like Grafana Alloy. It introduces slightly more infrastructure to manage, but the operational resilience is absolutely worth it.
Lesson 3: Metrics Need A Different Collection Strategy
While pushing logs makes more sense, the Pull strategy is the absolute standard when it comes to metrics. This is where Prometheus shines.
At its core, Prometheus is an open-source monitoring system. Prometheus is specifically designed to store numbers that change over time like tracking how much CPU your application uses minute by minute, or how many active connections it currently has. It stores these metrics as a stream of timestamped values and uses a powerful query language (PromQL) to aggregate and analyze them on the fly.
In our project, we use Prometheus exclusively for metrics collection, not logs. Our Spring Boot services expose health data things like memory usage, HTTP error rates, and database query latency through Spring Boot Actuator. Under the hood, a library called Micrometer translates these internal metrics into a format the backend understands.
Traditionally, for Prometheus, this meant exposing a simple, text-based endpoint that the Prometheus server actively “scrapes” (e.g., every 15 seconds) using a simple HTTP GET request. The application doesn’t actively push this data outwards; Prometheus reaches out to pull it.
However, the modern industry standard is rapidly shifting toward OpenTelemetry (OTel), an open-source framework backed by the Cloud Native Computing Foundation to collect, process, and export telemetry data. OTLP is a push model, in which your app sends metrics to a collector. The key enabler here is a standard wire protocol called OTLP. Instead of relying on a Prometheus-specific text format, Spring Boot can now use Micrometer (specifically the OtlpMeterRegistry) to actively push metrics in the standard OTLP format directly to an OpenTelemetry Collector or backend. This is a powerful shift because the OTLP protocol abstracts away the specific API used to instrument your application, unifying metrics, traces, and logs.
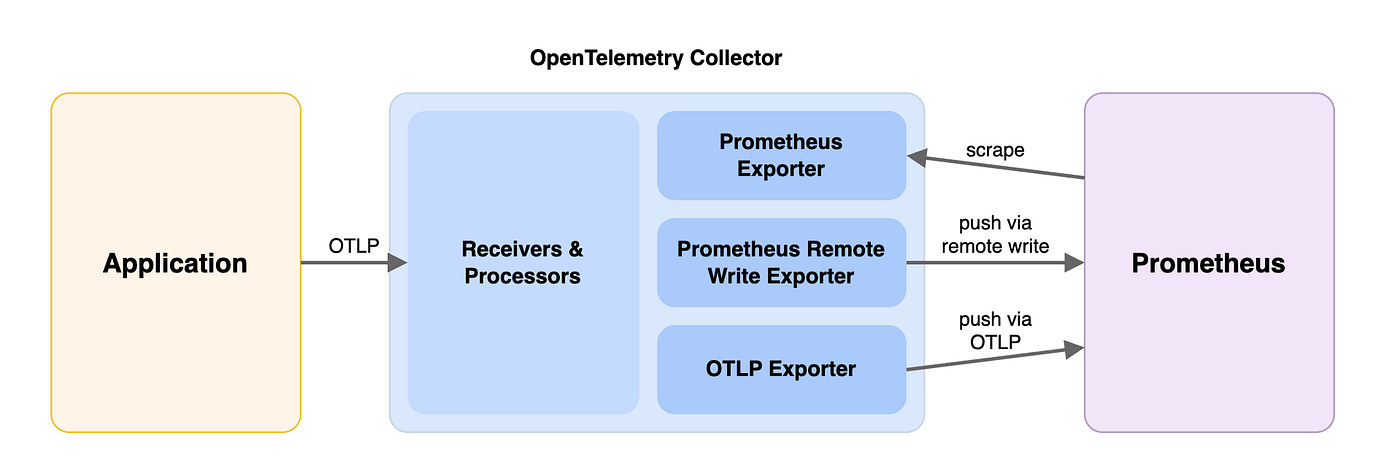
So, if push-based OTLP is the new standard, why stick with Prometheus’s traditional pull model?
While OTLP is fantastic for unifying signals, the pull model still has distinct advantages for our specific setup regarding service discovery and reliability. Because Prometheus actively reaches out to known targets, it immediately knows when a service stops responding. The absence of data is itself health information. With a push model, you have to distinguish between “the service stopped sending” and “the service is down,” which is harder than it sounds.
Additionally, the monitoring server stays in control. If Prometheus gets overloaded, it might skip or delay a scrape, but it is never at the mercy of services flooding it with data it didn’t ask for. More importantly, missing a scrape doesn’t corrupt your data. Because applications expose metrics like request volumes as cumulative counters, the application simply keeps counting while Prometheus is busy. When Prometheus eventually pulls the data, it captures the true, accumulated total, ensuring your calculated rates remain perfectly accurate. This also brings simplicity to the application side. Services just expose an endpoint. They don’t need to know where Prometheus lives, handle connection failures, or manage retry logic. This is the exact same decoupling principle from Lesson 2, just applied differently with a pull strategy instead of using an agent combined with a push strategy.
Putting It All Together
By combining these two distinct strategies, pushing irregular log events and pulling steady health metrics via Prometheus, we created a highly optimized, resilient infrastructure. We get the best of both worlds: real-time error tracking and stable, low-overhead performance monitoring. When set up correctly, the logs don’t slow the application down because of the dedicated agent. As for the metrics, while the application still has to spend a tiny amount of resources answering Prometheus’s HTTP scrape requests, the overhead of this pull method is entirely predictable and remarkably low compared to actively pushing complex data streams outwards.
Looking back, navigating this stack taught me the absolute importance of a good observability stack. It’s actually a bit ironic: at the beginning of the project, I thought this monitoring stack was completely overkill. Now, if we could restart the project today, the one major architectural decision I would change is to add even more infrastructure. I would use an agent strategy for Loki right from the start to fully decouple our logging from our application health.
Ultimately, this project taught me that as a software engineer, you can never prepare too much for going live. The more we care about our live infrastructure, including but not limited to our monitoring setup, the more stress-free a launch experience we will have.
Explore Our Latest Insights
Stay updated with our expert articles and tips.






Discuss Your Web Development Project with Our Experts Today.
Discover how our tailored web development solutions can elevate your business to new heights.
Stay Connected with Us
Follow us on social media for the latest insights and updates in the tech industry.